MultiLR: Predictive models
STA 210 - Summer 2022
Yunran Chen
Welcome
Topics
- Building predictive multinomial logistic regression models
- Comparing models
- Unbalanced data
- Choosing the “final” model
Computational setup
Terminology
What’s the difference between regression and classification?
- Logistic regression / binary classification
- Multinomial logistic regression / multinomial classification
Data
Volcanoes
The data come from The Smithsonian Institution, via TidyTuesday.
 [1] "volcano_number"           "volcano_name"
 [3] "primary_volcano_type"     "last_eruption_year"
 [5] "country"                  "region"
 [7] "subregion"                "latitude"
 [9] "longitude"                "elevation"
[11] "tectonic_settings"        "evidence_category"
[13] "major_rock_1"             "major_rock_2"
[15] "major_rock_3"             "major_rock_4"
[17] "major_rock_5"             "minor_rock_1"
[19] "minor_rock_2"             "minor_rock_3"
[21] "minor_rock_4"             "minor_rock_5"
[23] "population_within_5_km"   "population_within_10_km"
[25] "population_within_30_km"  "population_within_100_km"
Volcanoes
Rows: 958
Columns: 26
$ volcano_number           <dbl> 283001, 355096, 342080, 213004, 321040, 28317…
$ volcano_name             <chr> "Abu", "Acamarachi", "Acatenango", "Acigol-Ne…
$ primary_volcano_type     <chr> "Shield(s)", "Stratovolcano", "Stratovolcano(…
$ last_eruption_year       <chr> "-6850", "Unknown", "1972", "-2080", "950", "…
$ country                  <chr> "Japan", "Chile", "Guatemala", "Turkey", "Uni…
$ region                   <chr> "Japan, Taiwan, Marianas", "South America", "…
$ subregion                <chr> "Honshu", "Northern Chile, Bolivia and Argent…
$ latitude                 <dbl> 34.500, -23.292, 14.501, 38.537, 46.206, 37.6…
$ longitude                <dbl> 131.600, -67.618, -90.876, 34.621, -121.490, …
$ elevation                <dbl> 641, 6023, 3976, 1683, 3742, 1728, 1733, 1250…
$ tectonic_settings        <chr> "Subduction zone / Continental crust (>25 km)…
$ evidence_category        <chr> "Eruption Dated", "Evidence Credible", "Erupt…
$ major_rock_1             <chr> "Andesite / Basaltic Andesite", "Dacite", "An…
$ major_rock_2             <chr> "Basalt / Picro-Basalt", "Andesite / Basaltic…
$ major_rock_3             <chr> "Dacite", " ", " ", "Basalt / Picro-Basalt", …
$ major_rock_4             <chr> " ", " ", " ", "Andesite / Basaltic Andesite"…
$ major_rock_5             <chr> " ", " ", " ", " ", " ", " ", " ", " ", " ", …
$ minor_rock_1             <chr> " ", " ", "Basalt / Picro-Basalt", " ", "Daci…
$ minor_rock_2             <chr> " ", " ", " ", " ", " ", "Basalt / Picro-Basa…
$ minor_rock_3             <chr> " ", " ", " ", " ", " ", " ", " ", "Andesite …
$ minor_rock_4             <chr> " ", " ", " ", " ", " ", " ", " ", " ", " ", …
$ minor_rock_5             <chr> " ", " ", " ", " ", " ", " ", " ", " ", " ", …
$ population_within_5_km   <dbl> 3597, 0, 4329, 127863, 0, 428, 101, 51, 0, 98…
$ population_within_10_km  <dbl> 9594, 7, 60730, 127863, 70, 3936, 485, 6042, …
$ population_within_30_km  <dbl> 117805, 294, 1042836, 218469, 4019, 717078, 1…
$ population_within_100_km <dbl> 4071152, 9092, 7634778, 2253483, 393303, 5024…
Types of volcanoes
Probably too many types!
# A tibble: 26 × 2
   primary_volcano_type     n
   <chr>                <int>
 1 Stratovolcano          353
 2 Stratovolcano(es)      107
 3 Shield                  85
 4 Volcanic field          71
 5 Pyroclastic cone(s)     70
 6 Caldera                 65
 7 Complex                 46
 8 Shield(s)               33
 9 Submarine               27
10 Lava dome(s)            26
11 Fissure vent(s)         12
12 Caldera(s)               9
13 Compound                 9
14 Maar(s)                  8
15 Pyroclastic shield       7
16 Tuff cone(s)             7
17 Crater rows              5
18 Subglacial               5
19 Pyroclastic cone         4
20 Lava dome                3
21 Complex(es)              1
22 Lava cone                1
23 Lava cone(es)            1
24 Lava cone(s)             1
25 Stratovolcano?           1
26 Tuff cone                1
Relevel volcanoes
volcano <- volcano %>%
  mutate(
    volcano_type = case_when(
      str_detect(primary_volcano_type, "Stratovolcano") ~ "Stratovolcano",
      str_detect(primary_volcano_type, "Shield") ~ "Shield",
      TRUE ~ "Other"
    ),
    volcano_type = fct_relevel(volcano_type, "Stratovolcano", "Shield", "Other")
  )

volcano %>%
  count(volcano_type)
# A tibble: 3 × 2
volcano_type n
<fct> <int>
1 Stratovolcano 461
2 Shield 118
3 Other 379Data prep
- Select a few variables as predictors for the model with
- Convert all character variables to factors
Mapping the volcanoes

World map data
# A tibble: 99,338 × 6
long lat group order region subregion
<dbl> <dbl> <dbl> <int> <chr> <chr>
1 -69.9 12.5 1 1 Aruba <NA>
2 -69.9 12.4 1 2 Aruba <NA>
3 -69.9 12.4 1 3 Aruba <NA>
4 -70.0 12.5 1 4 Aruba <NA>
5 -70.1 12.5 1 5 Aruba <NA>
6 -70.1 12.6 1 6 Aruba <NA>
7 -70.0 12.6 1 7 Aruba <NA>
8 -70.0 12.6 1 8 Aruba <NA>
9 -69.9 12.5 1 9 Aruba <NA>
10 -69.9 12.5 1 10 Aruba <NA>
# … with 99,328 more rowsDraw world map

Add volcanoes

Build a model
Split into testing/training
Create a recipe
Start with a model that doesn’t use geographic information:
step_other creates a specification of a recipe step that will potentially pool infrequently occurring values into an “other” category.
Specify a model
Create a workflow
volcano_wflow1 <- workflow() %>%
add_recipe(volcano_rec1) %>%
add_model(volcano_spec)
volcano_wflow1══ Workflow ════════════════════════════════════════════════════════════════════
Preprocessor: Recipe
Model: multinom_reg()
── Preprocessor ────────────────────────────────────────────────────────────────
6 Recipe Steps
• step_rm()
• step_other()
• step_other()
• step_dummy()
• step_zv()
• step_center()
── Model ───────────────────────────────────────────────────────────────────────
Multinomial Regression Model Specification (classification)
Computational engine: nnet Create cross validation folds
Fit resamples
volcano_fit_rs1 <- volcano_wflow1 %>%
fit_resamples(
volcano_folds,
control = control_resamples(save_pred = TRUE)
)
volcano_fit_rs1# Resampling results
# 5-fold cross-validation
# A tibble: 5 × 5
splits id .metrics .notes .predictions
<list> <chr> <list> <list> <list>
1 <split [574/144]> Fold1 <tibble [2 × 4]> <tibble [0 × 3]> <tibble [144 × 7]>
2 <split [574/144]> Fold2 <tibble [2 × 4]> <tibble [0 × 3]> <tibble [144 × 7]>
3 <split [574/144]> Fold3 <tibble [2 × 4]> <tibble [0 × 3]> <tibble [144 × 7]>
4 <split [575/143]> Fold4 <tibble [2 × 4]> <tibble [0 × 3]> <tibble [143 × 7]>
5 <split [575/143]> Fold5 <tibble [2 × 4]> <tibble [0 × 3]> <tibble [143 × 7]>Collect metrics
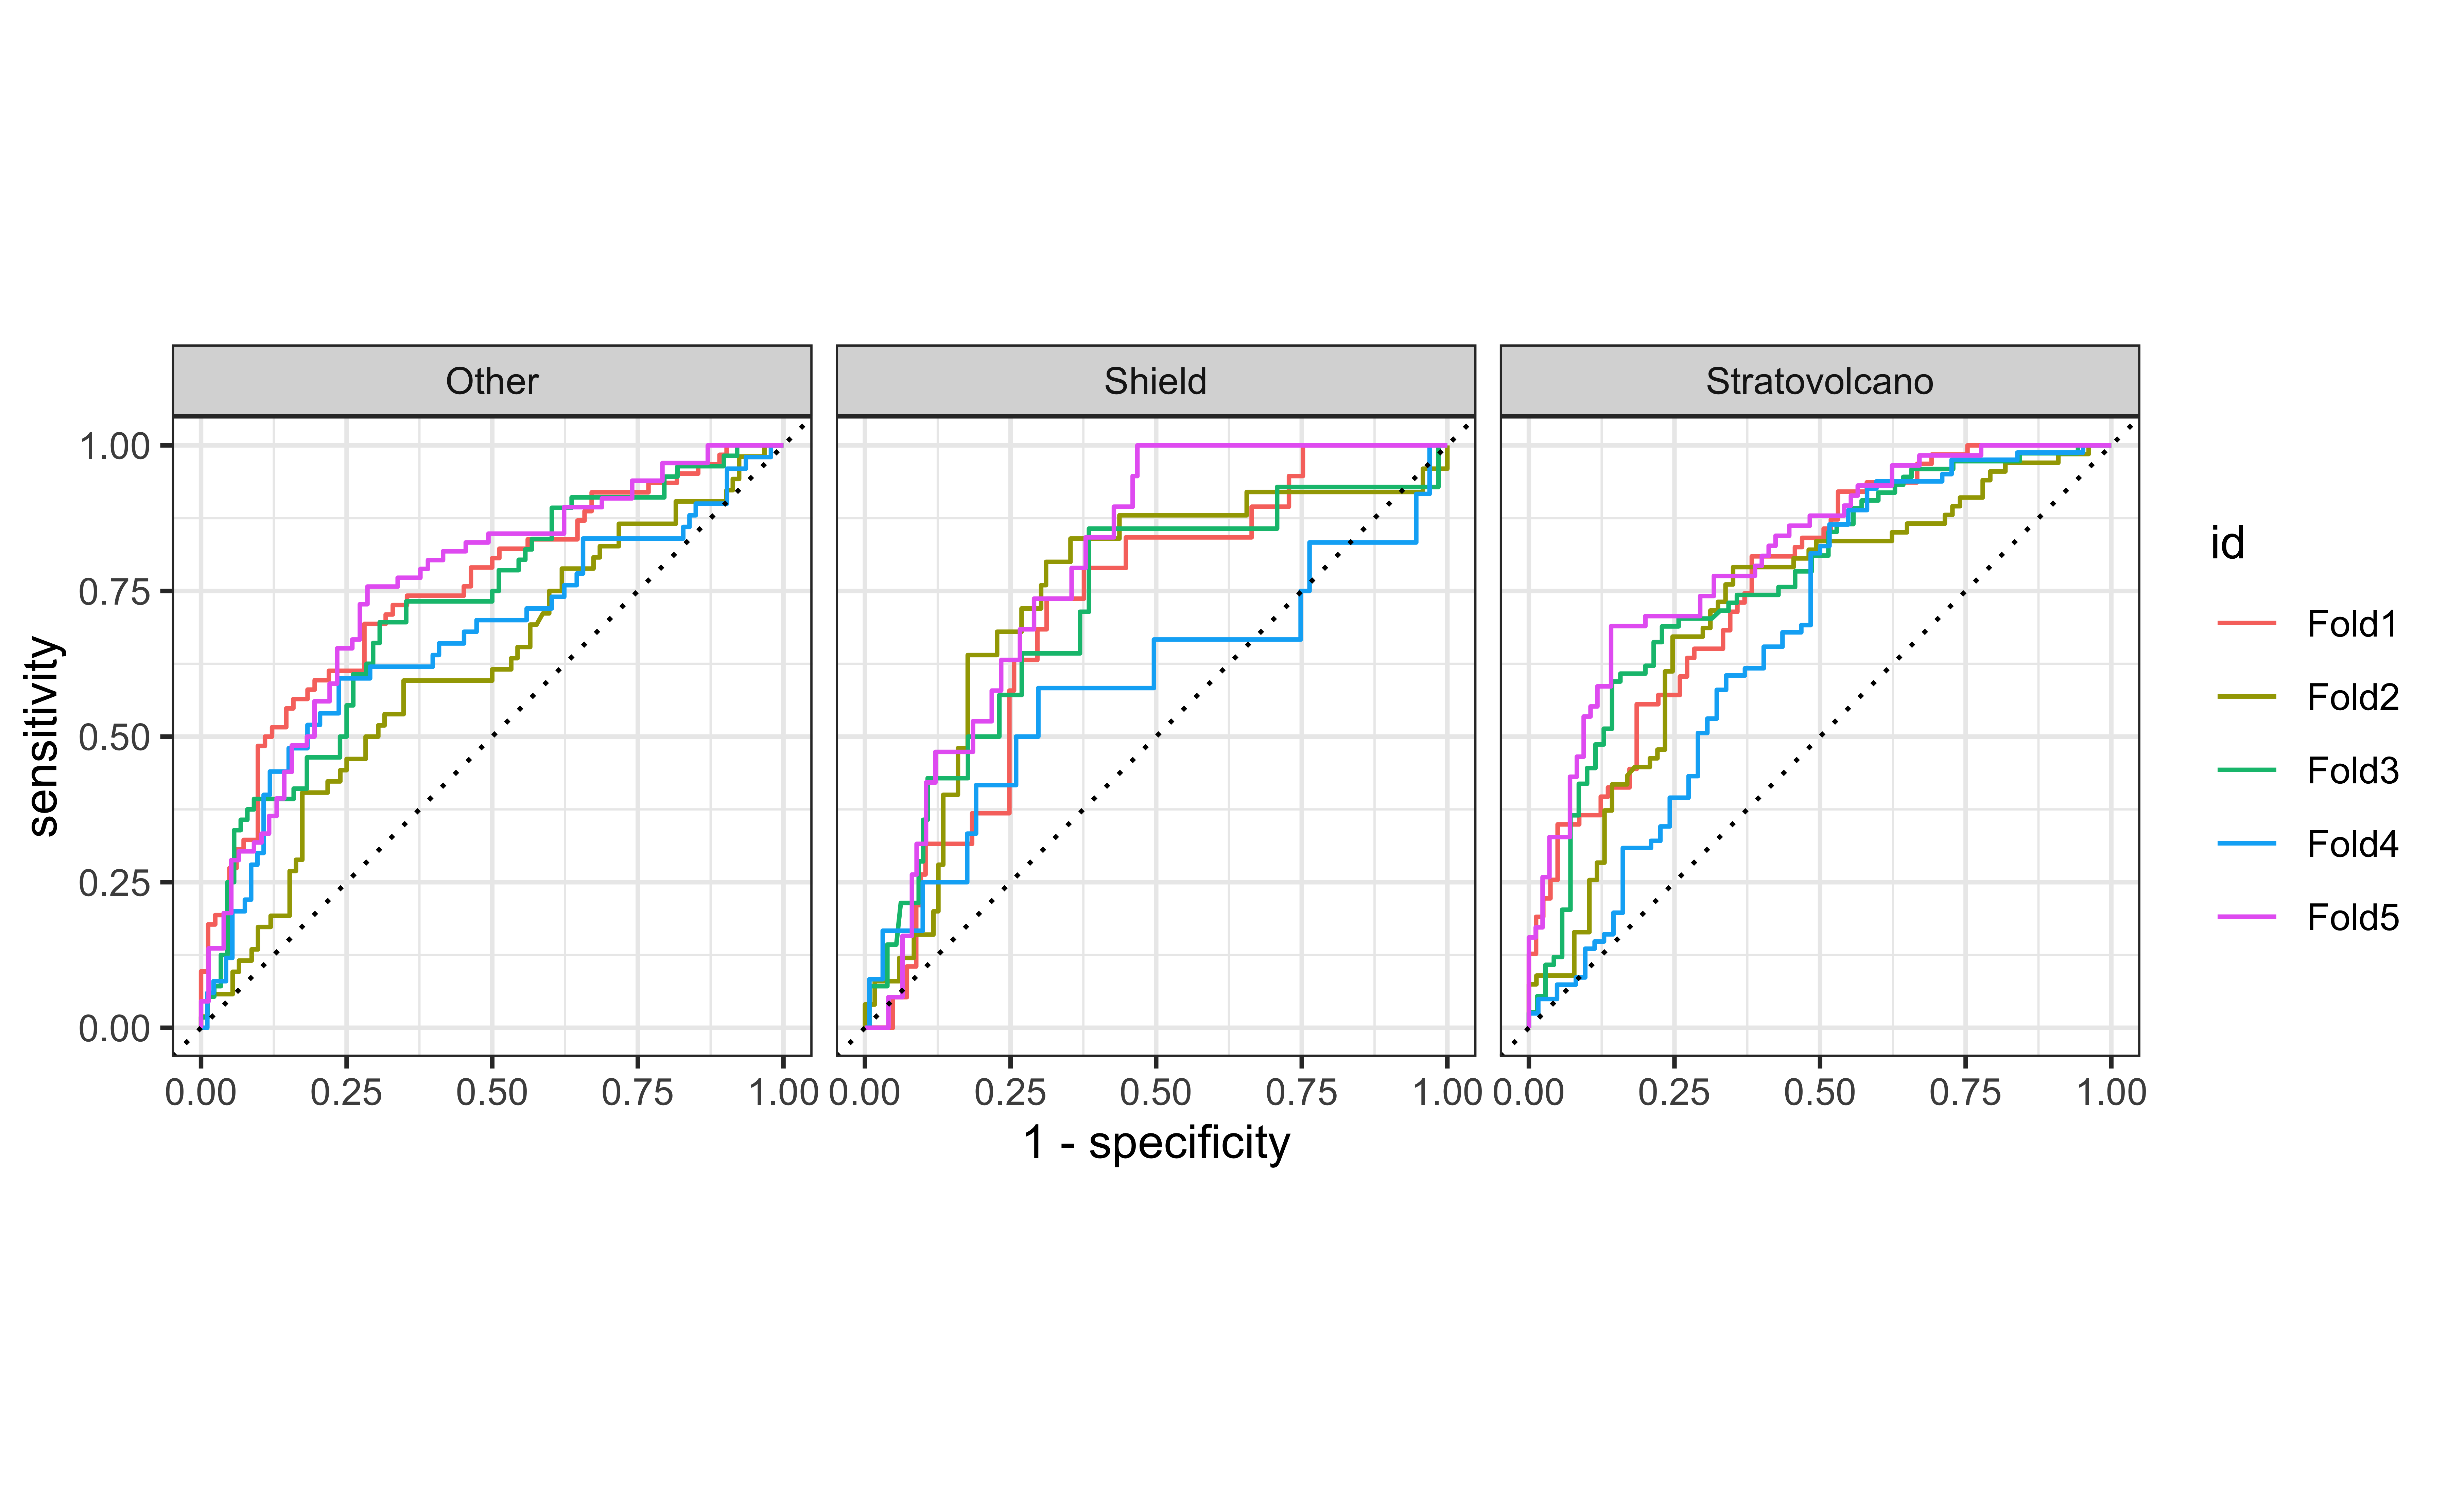
ROC curve
ROC curves for multiclass outcomes use a one-vs-all approach: calculate multiple curves, one per level vs. all other levels.
ROC curve - under the hood
An additional column, .level, identifies the “one” column in the one-vs-all calculation:

ROC curve
Unbalanced data
Unbalanced data
Remember that the observed volcano types are unbalanced:
# A tibble: 3 × 2
volcano_type n
<fct> <int>
1 Stratovolcano 461
2 Shield 118
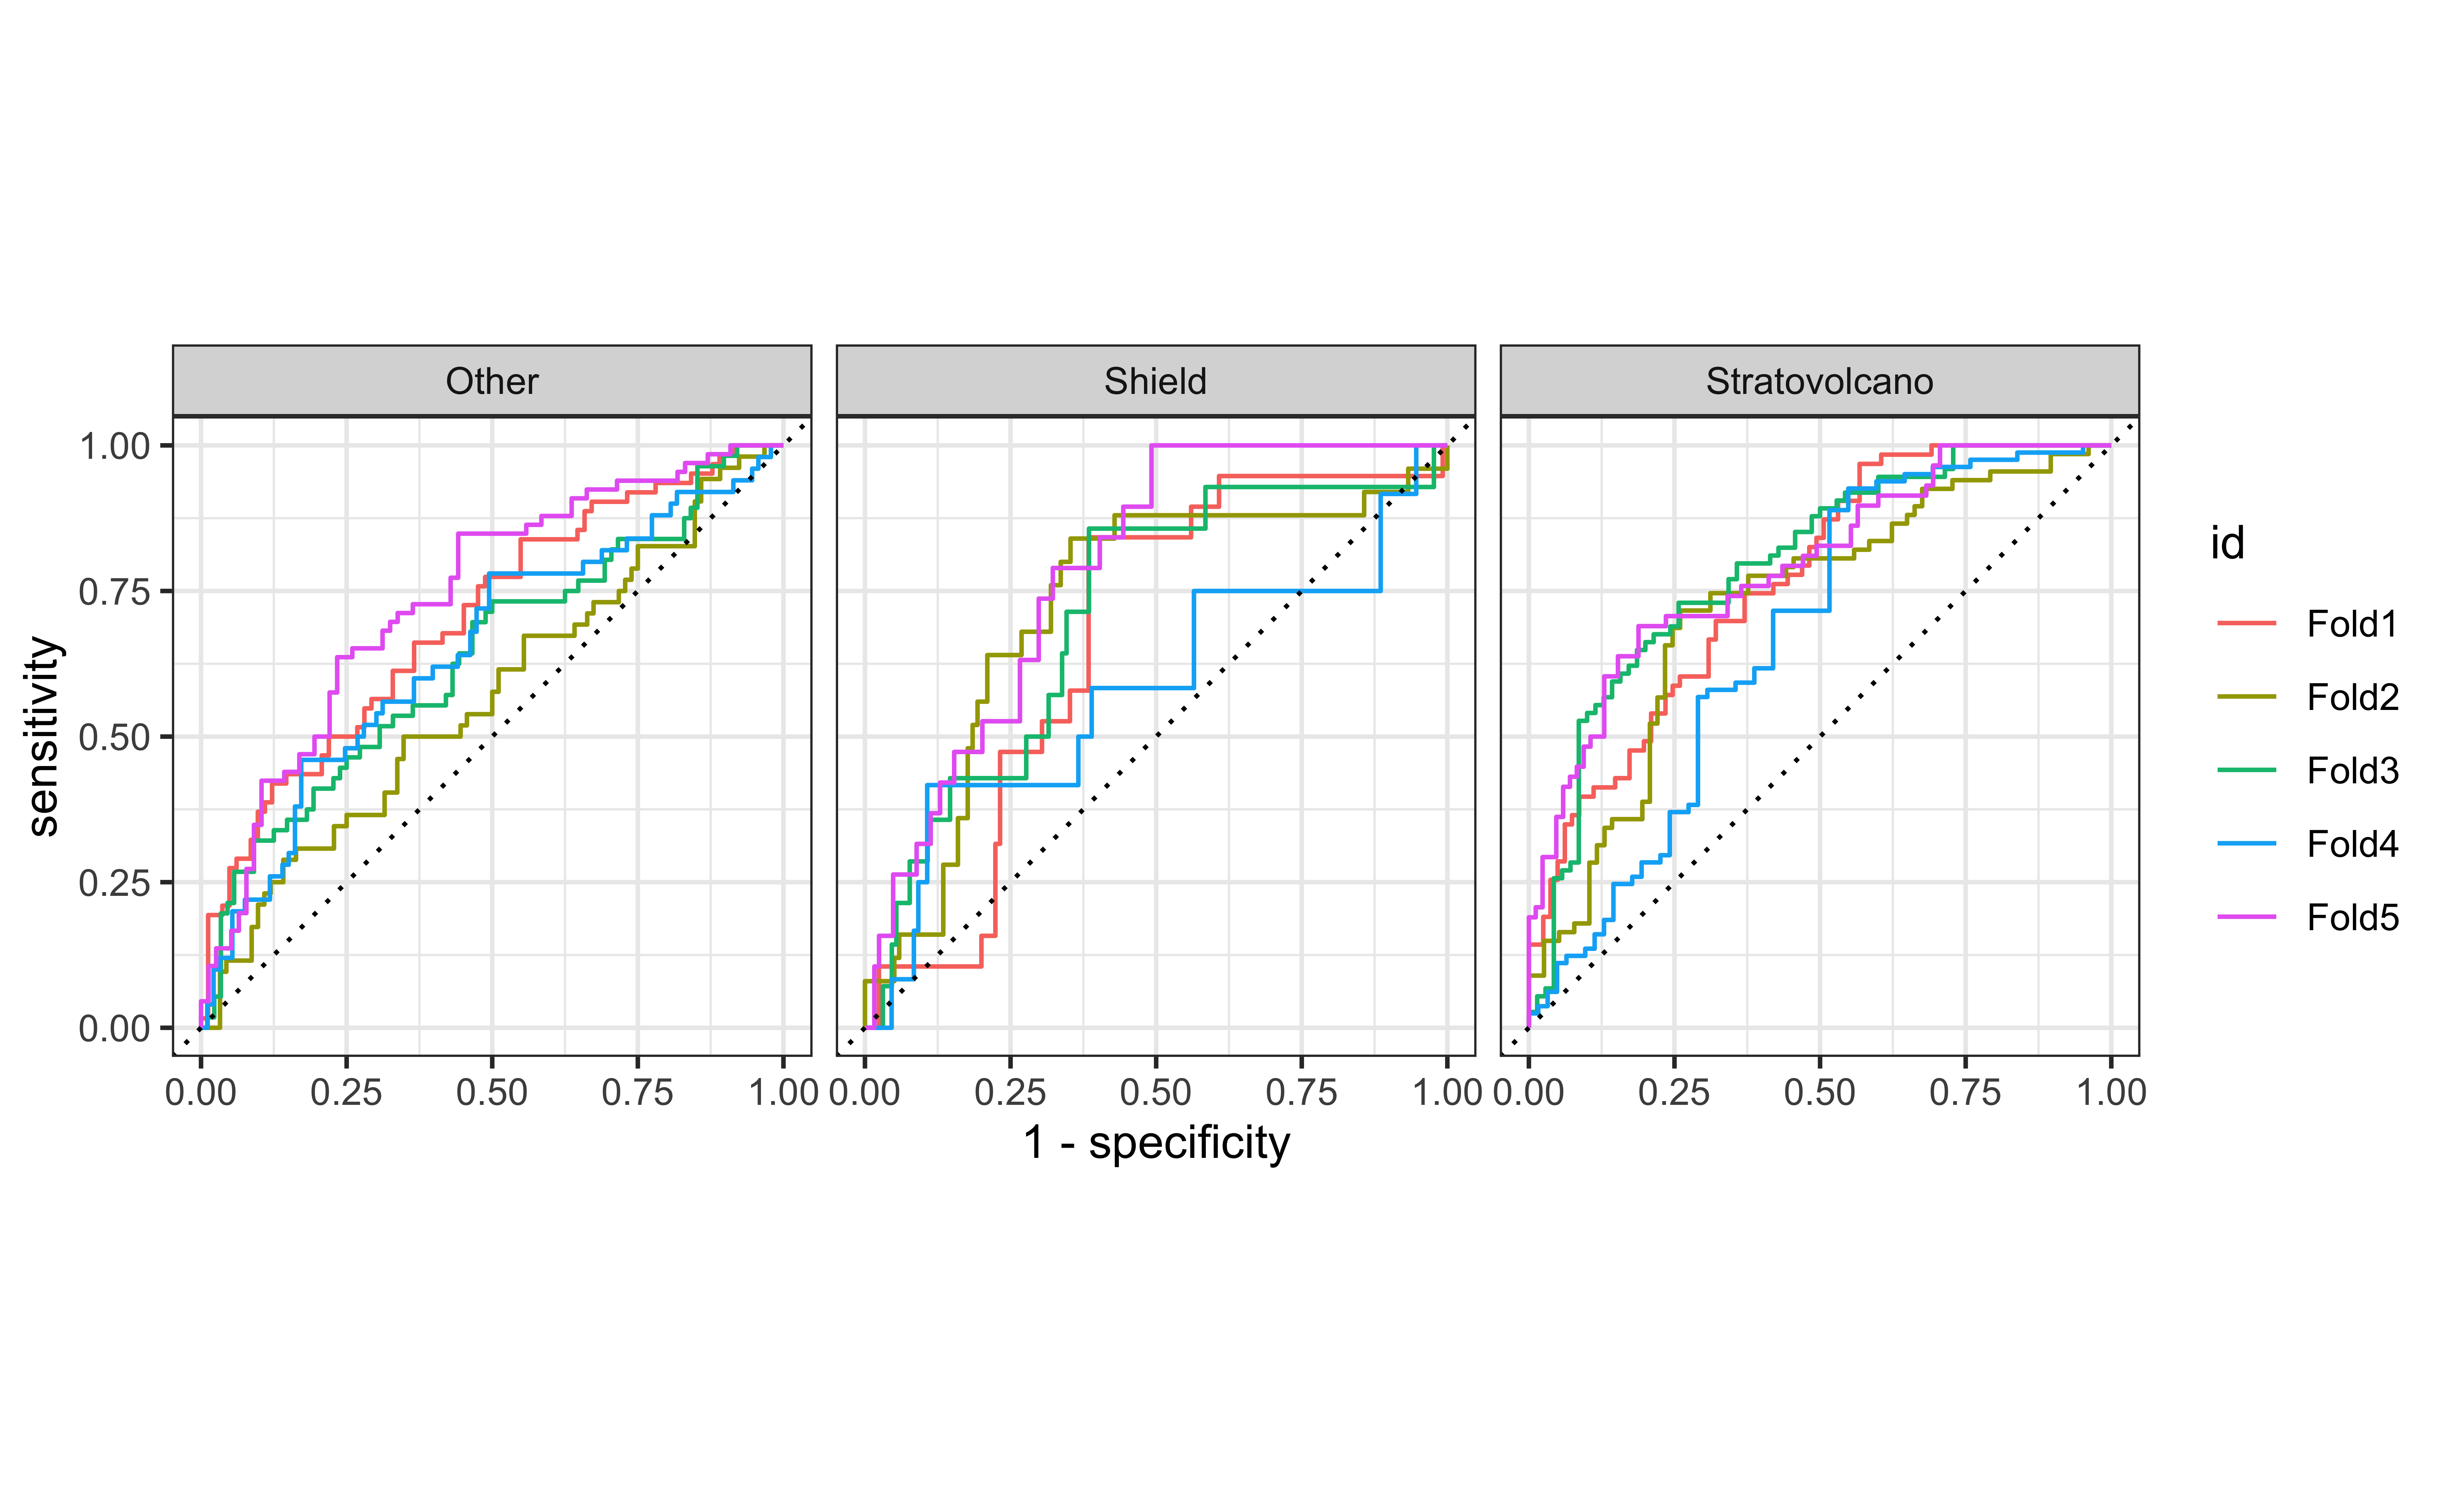
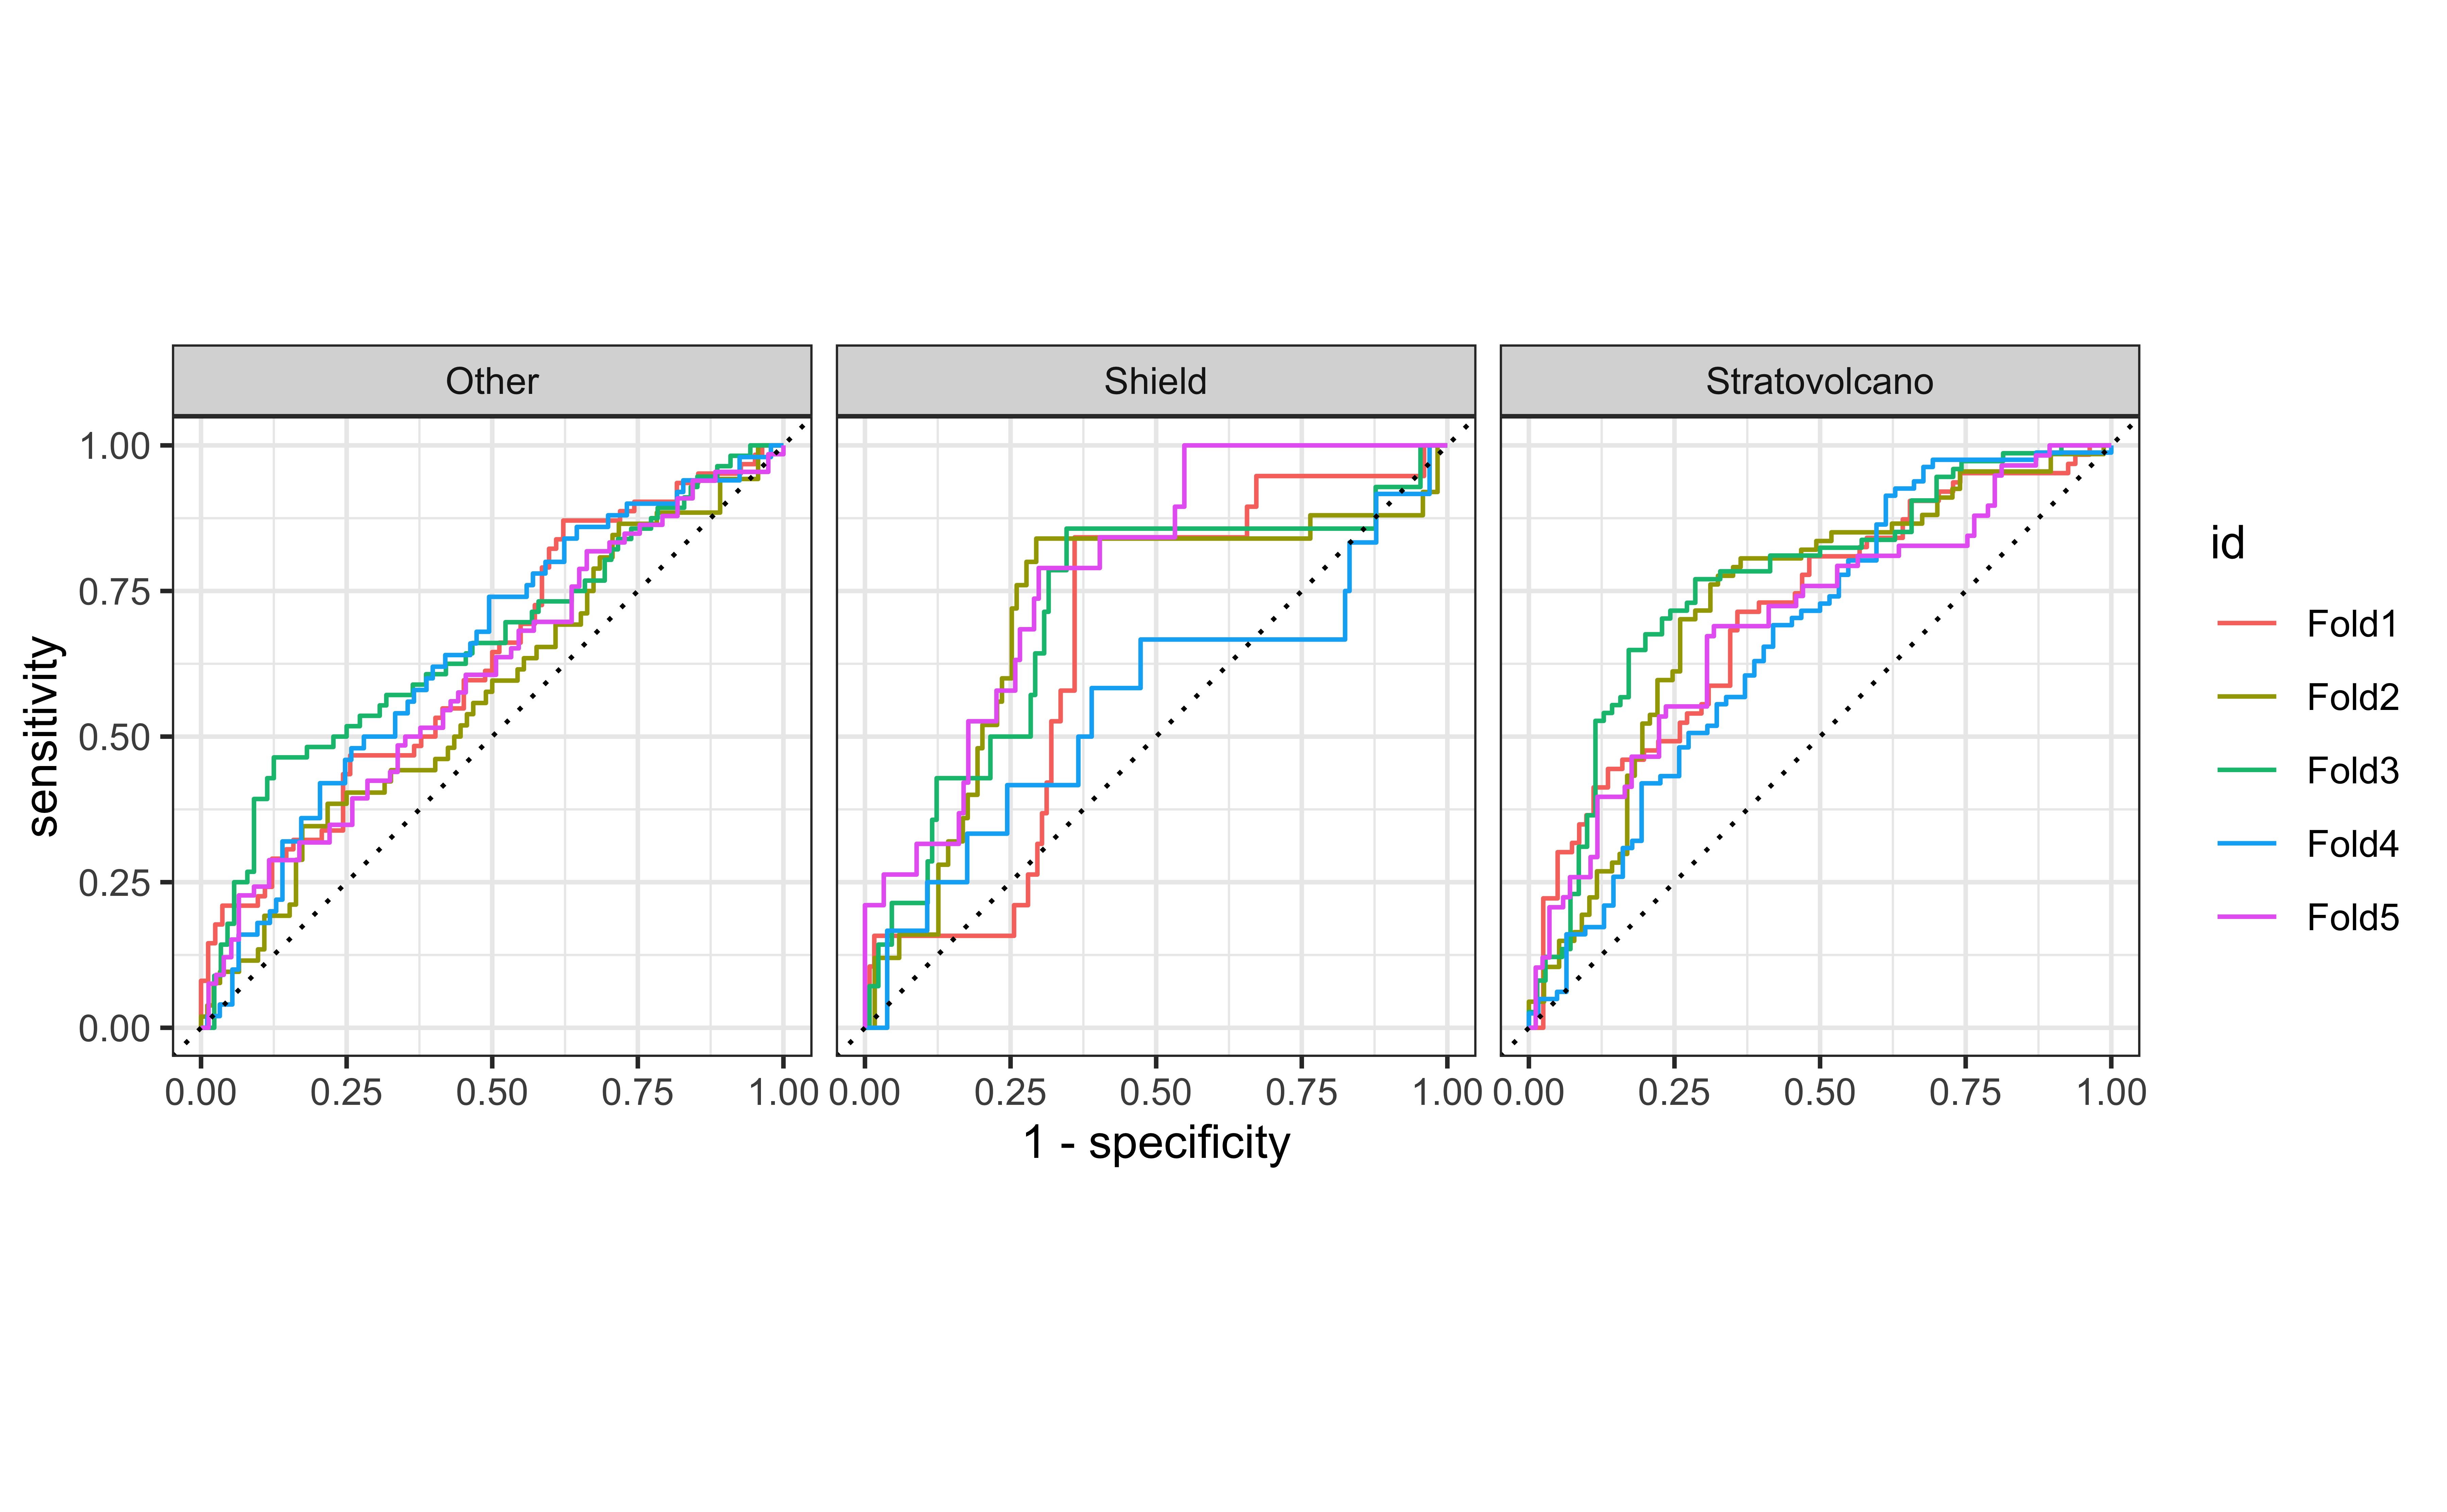
3 Other 379For educational purpose, we consider some statistical tools to address this issue.
Addressing unbalance
To address class unbalance, we generally use
- oversampling data from levels that are less prevalent in the data
- e.g.,
step_smote(): Uses a technique called “Synthetic Minority Over-sampling Technique” to generate new examples of the minority class using nearest neighbors of these cases.
- e.g.,
- downsampling data from levels that are more prevalent in the data
- e.g.,
step_downsample(): Removes rows of a data set to make the occurrence of levels in a specific factor level equal.
- e.g.,
New recipe - oversample
New recipe - downsample
New workflows
Fit resamples
Collect metrics
# A tibble: 2 × 6
  .metric  .estimator  mean     n std_err .config
  <chr>    <chr>      <dbl> <int>   <dbl> <chr>
1 accuracy multiclass 0.510     5  0.0169 Preprocessor1_Model1
2 roc_auc hand_till 0.693 5 0.0243 Preprocessor1_Model1# A tibble: 2 × 6
.metric .estimator mean n std_err .config
<chr> <chr> <dbl> <int> <dbl> <chr>
1 accuracy multiclass 0.504 5 0.0264 Preprocessor1_Model1
2 roc_auc hand_till 0.669 5 0.0147 Preprocessor1_Model1ROC curves - oversampling
ROC curves - downsampling
Addressing unbalance
Can you think of any issues resulting from over/down sampling?
Final model
The “chosen” model
Let’s stick to the models without over/down sampling.
From the application exercise:
volcano_rec2 <- recipe(volcano_type ~ ., data = volcano_train) %>%
  step_other(tectonic_settings) %>%
  step_other(major_rock_1) %>%
  step_dummy(all_nominal_predictors()) %>%
  step_zv(all_predictors()) %>%
  step_center(all_predictors())

volcano_wflow2 <- workflow() %>%
  add_recipe(volcano_rec2) %>%
  add_model(volcano_spec)
Fitting the final model
Confusion matrix
Confusion matrix - visualized

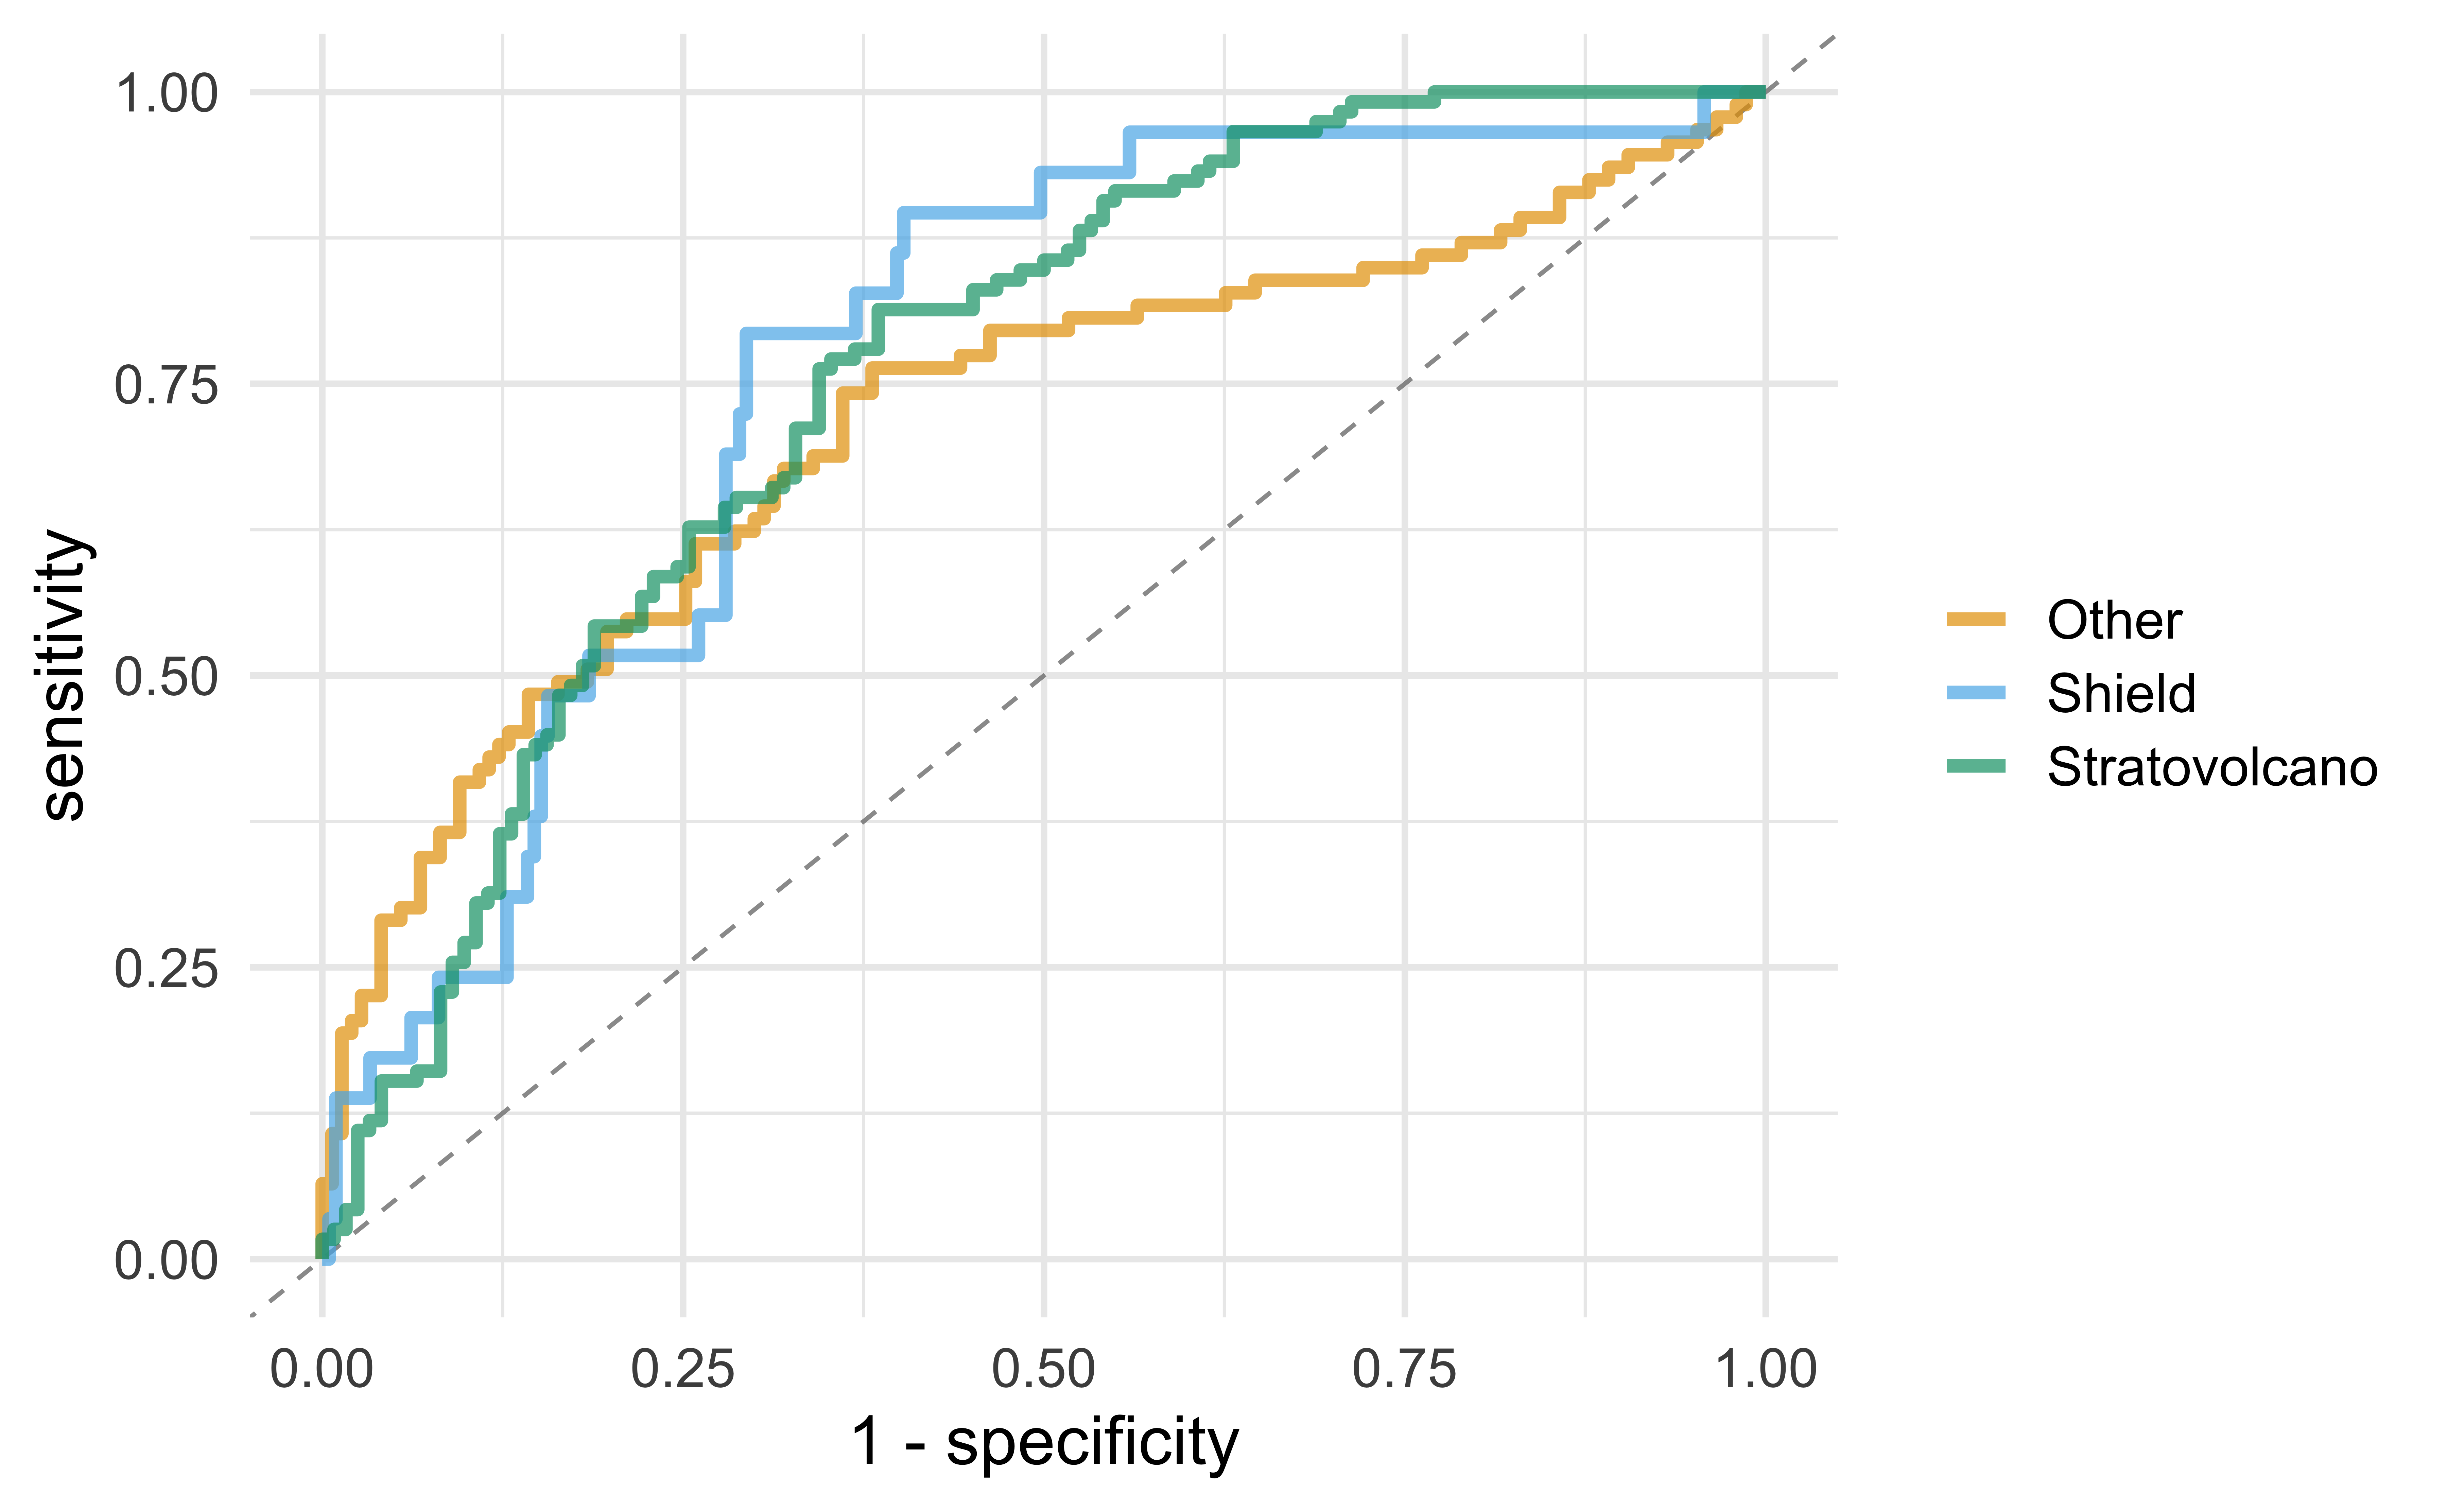
ROC curve
collect_predictions(final_fit) %>%
  roc_curve(truth = volcano_type, .pred_Stratovolcano:.pred_Other) %>%
  autoplot()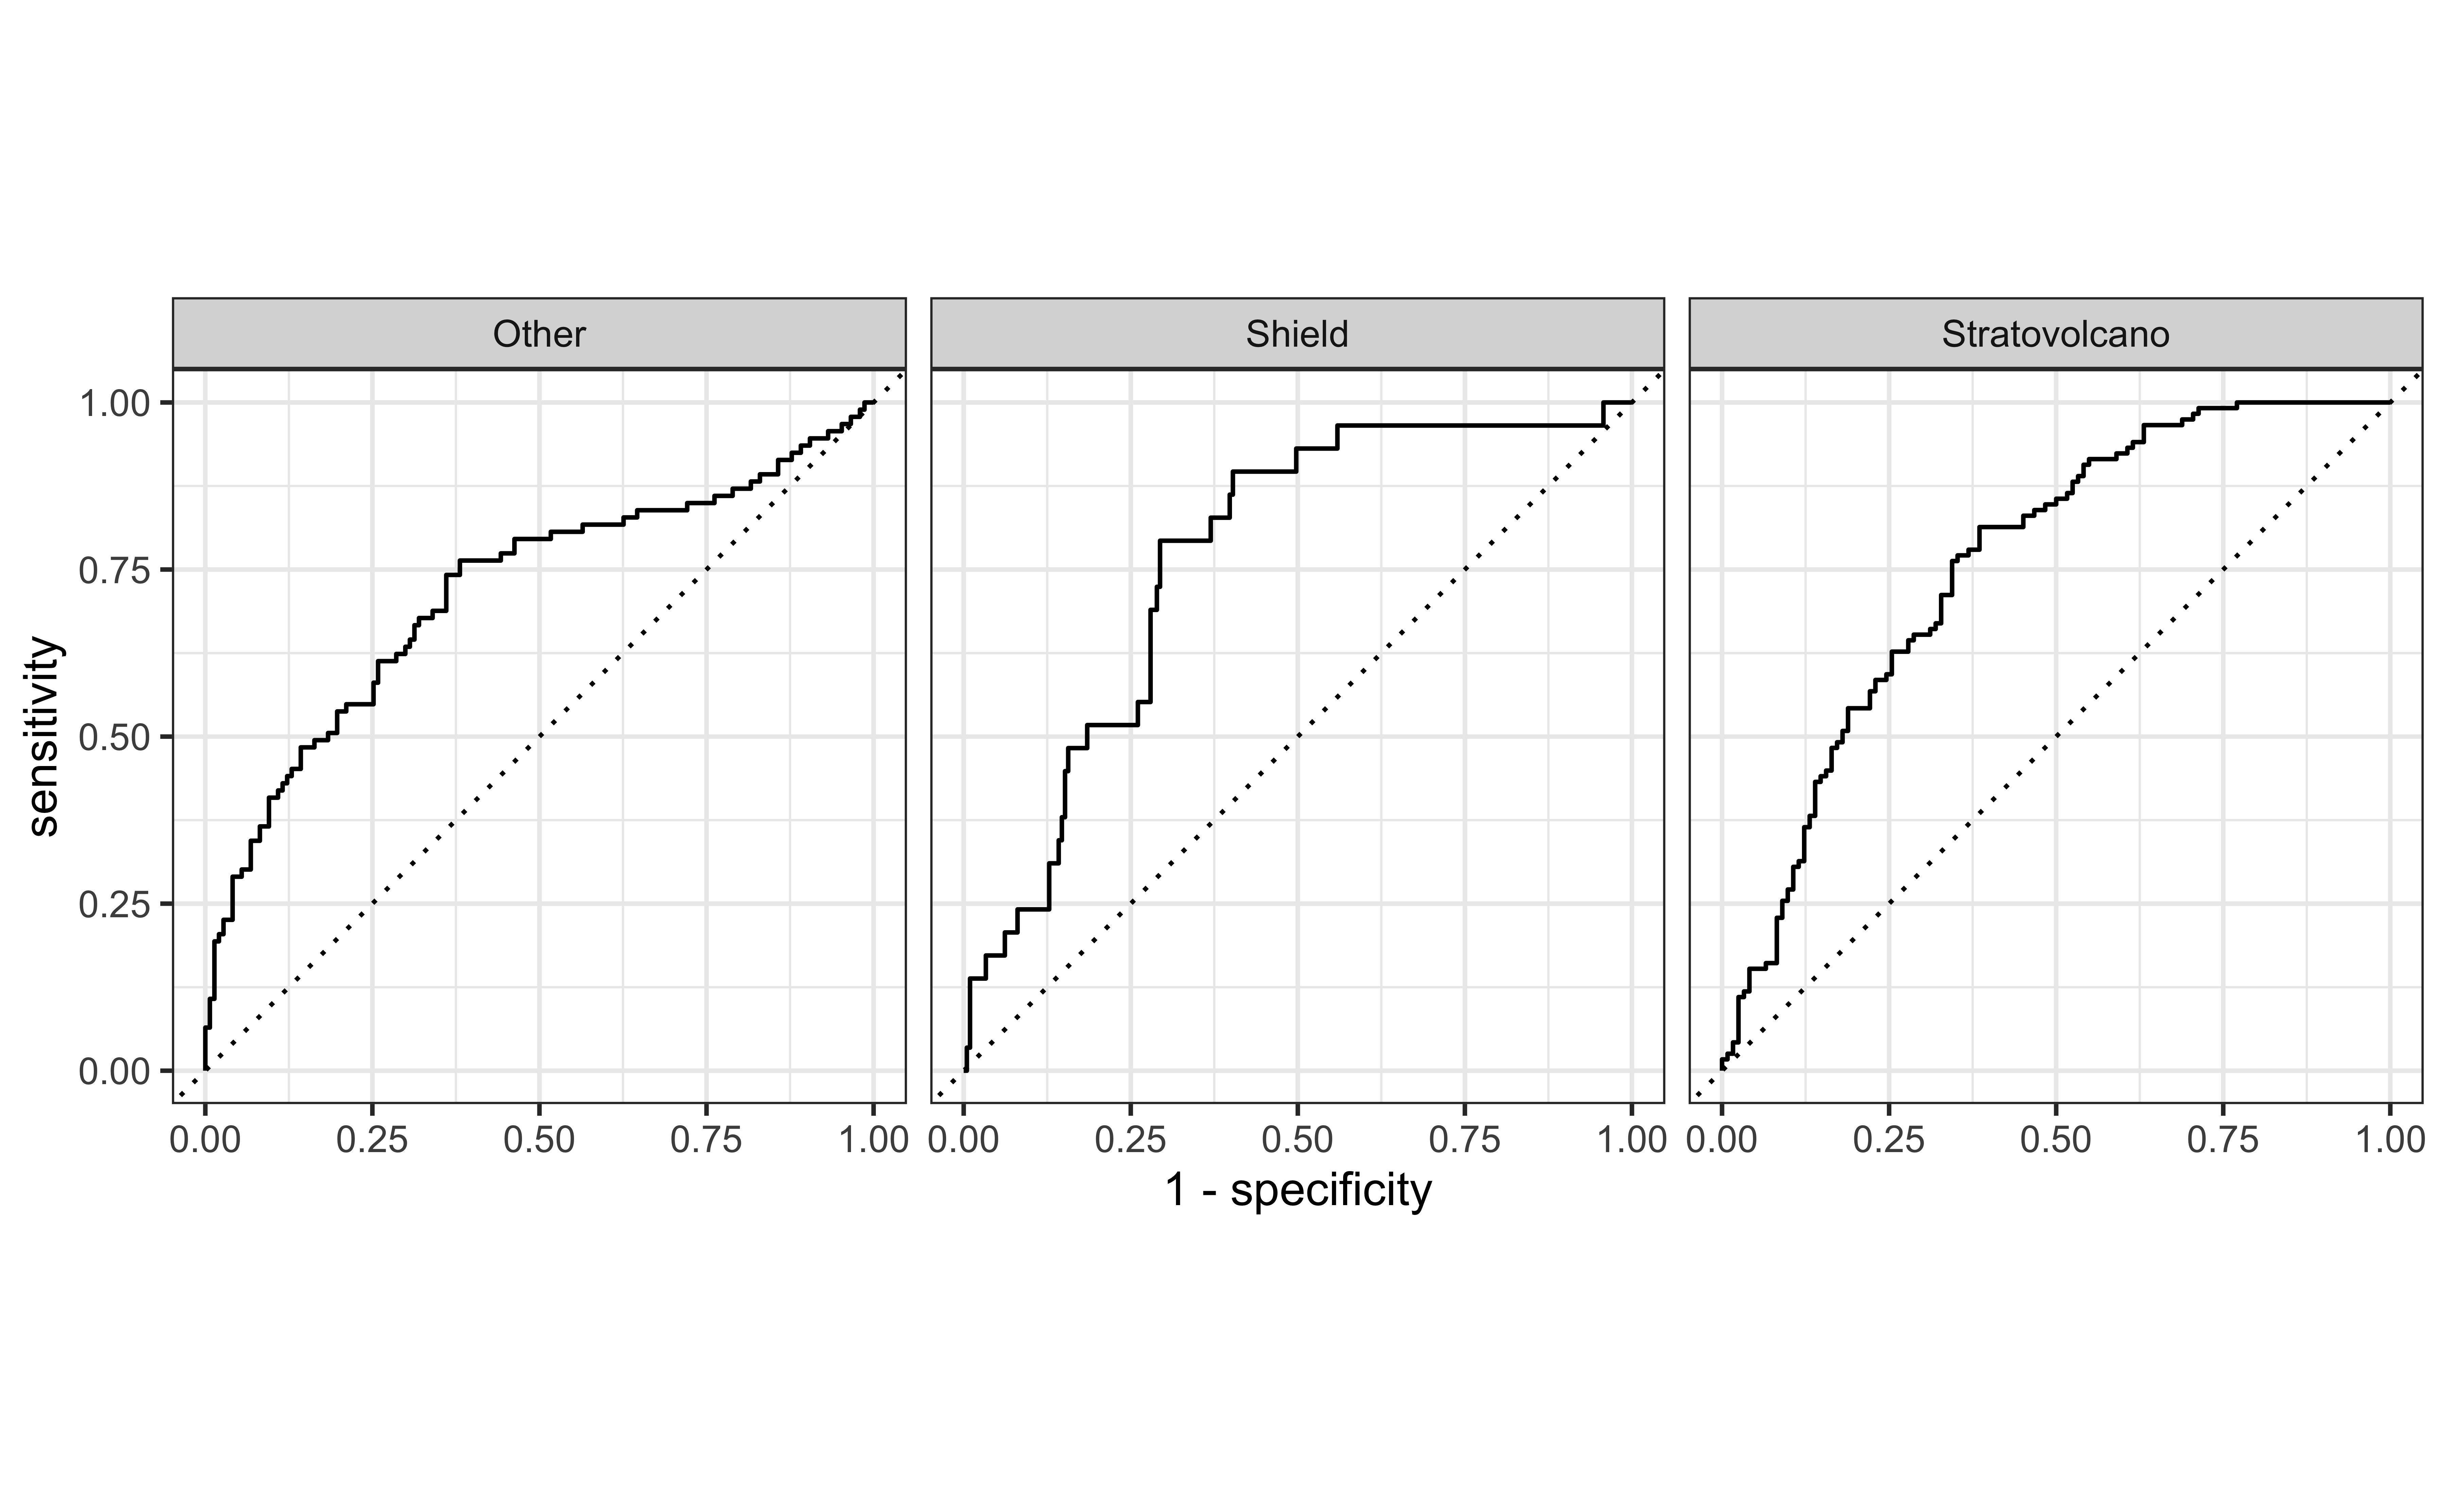
Prediction
final_fitted <- extract_workflow(final_fit)

new_volcano <- tibble(
  latitude = 35.9940,
  longitude = -78.8986,
  elevation = 404,
  tectonic_settings = "Subduction zone / Continental crust (>25 km)",
  major_rock_1 = "Andesite / Basaltic Andesite"
)

predict(
  final_fitted,
  new_volcano,
  type = "prob"
  )
# A tibble: 1 × 3
.pred_Stratovolcano .pred_Shield .pred_Other
<dbl> <dbl> <dbl>
1 0.381 0.0379 0.581Acknowledgements
Inspired by
- https://juliasilge.com/blog/multinomial-volcano-eruptions/
- https://juliasilge.com/blog/nber-papers/