library(tidyverse)
library(tidymodels)

rail_trail <- read_csv("data/rail_trail.csv")AE 8: Rail Trail
Important
Go to the course GitHub organization and locate the repo titled ae-8-rail-trail-YOUR_GITHUB_USERNAME to get started.
Packages and data
Exercise 1
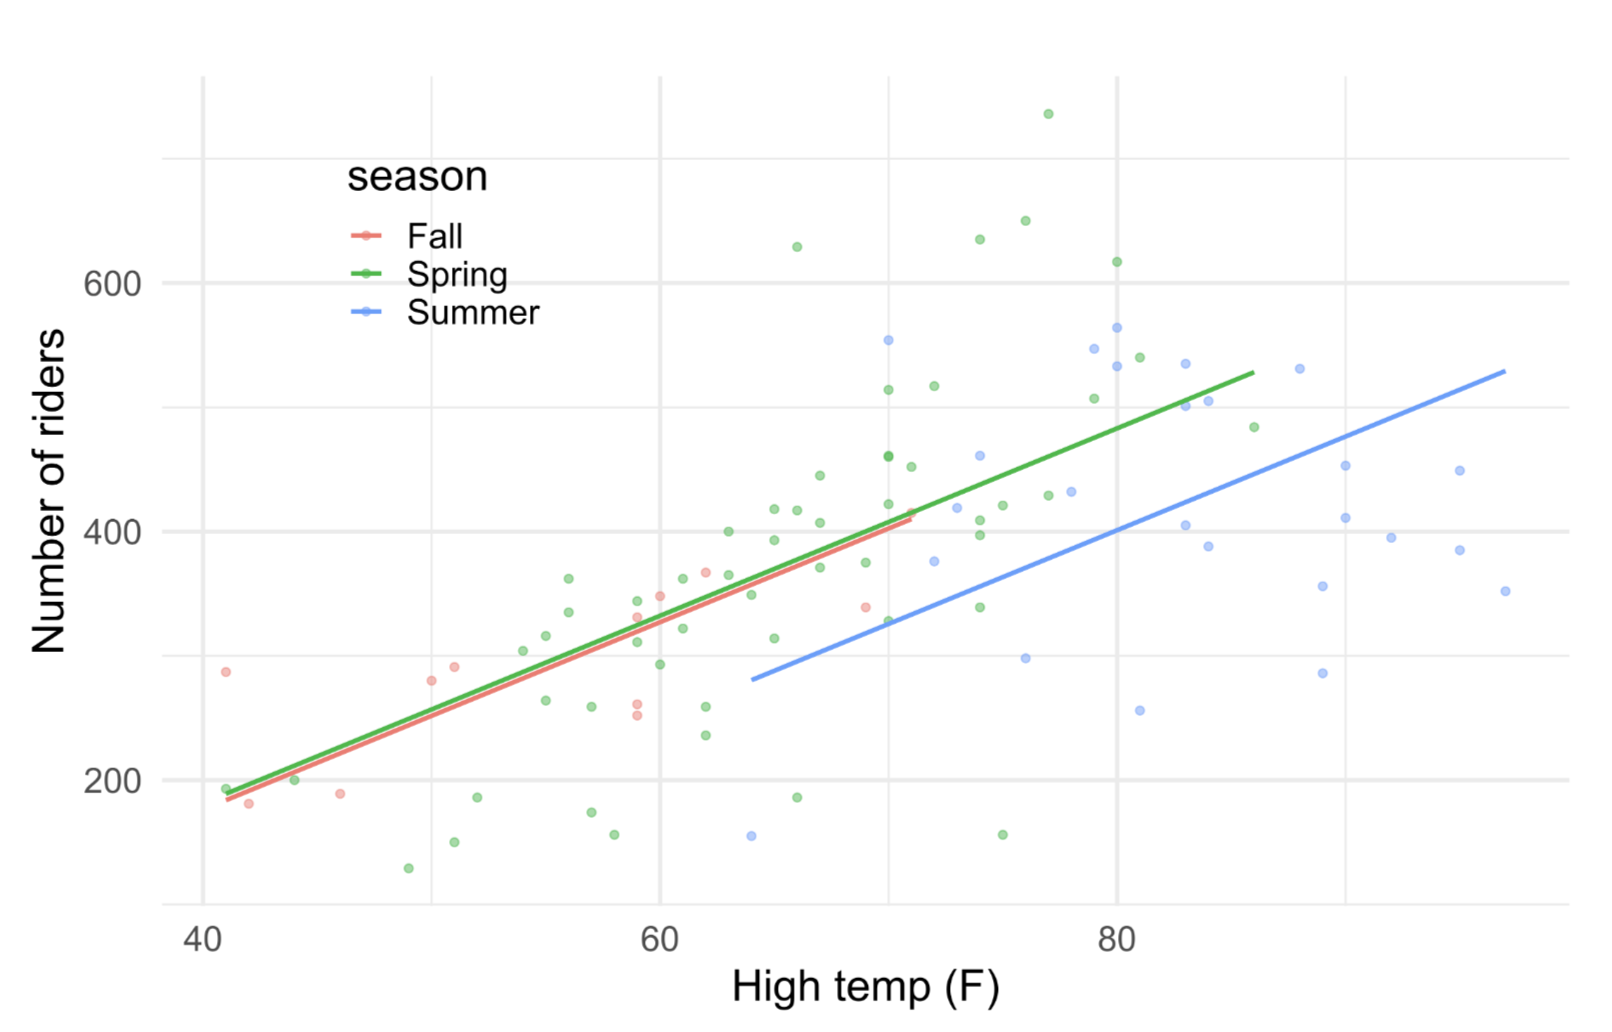
Fit a model predicting volume from hightemp and season.
rt_mlr_main_fit <- linear_reg() %>%
  set_engine("lm") %>%
  fit(volume ~ hightemp + season, data = rail_trail)

tidy(rt_mlr_main_fit)
# A tibble: 4 × 5
term estimate std.error statistic p.value
<chr> <dbl> <dbl> <dbl> <dbl>
1 (Intercept) -125. 71.7 -1.75 0.0841
2 hightemp 7.54 1.17 6.43 0.00000000692
3 seasonSpring 5.13 34.3 0.150 0.881
4 seasonSummer -76.8 47.7 -1.61 0.111 Recreate the following visualization which displays the three regression lines we can draw based on the results of this model.
# add code hereExercise 2
Add an interaction effect between hightemp and season and comment on the significance of the interaction predictors. Time permitting, visualize the interaction model as well.
# add code hereExercise 3
Fit a model predicting volume from all available predictors.
rt_full_fit <- linear_reg() %>%
  set_engine("lm") %>%
  fit(volume ~ ., data = rail_trail)

tidy(rt_full_fit)
# A tibble: 8 × 5
term estimate std.error statistic p.value
<chr> <dbl> <dbl> <dbl> <dbl>
1 (Intercept) 17.6 76.6 0.230 0.819
2 hightemp 7.07 2.42 2.92 0.00450
3 avgtemp -2.04 3.14 -0.648 0.519
4 seasonSpring 35.9 33.0 1.09 0.280
5 seasonSummer 24.2 52.8 0.457 0.649
6 cloudcover -7.25 3.84 -1.89 0.0627
7 precip -95.7 42.6 -2.25 0.0273
8 day_typeWeekend 35.9 22.4 1.60 0.113 Recreate the following visualization which displays a histogram of residuals (y-axis should be frequency) and a density curve overlaid.